AutoExplore issue reporting
Autonomous testing without specified test cases creates a unique challenge for issue reporting. How to present the information about the found issues in a way that it is easy to understand and reproduce without overloading the user with too much information?

Sampo Kivistö
Founder & CEO
AutoExplore issue reporting
Autonomous testing without specified test cases creates a unique challenge for issue reporting. How to present the information about the found issues in a way that it is easy to understand and reproduce without overloading the user with too much information?
Report categories
During test agent execution, the agent tests and analyzes many different aspects of the service under test in parallel. These analyzed aspects include HTML markup, network traffic, rendered user interface, application logs, and many more. As the agent executes, without breaks or pauses, it quickly generates a lot of information about the application.
The main reports view tries to help navigate this issue list by categorizing similar types of issues into groups.
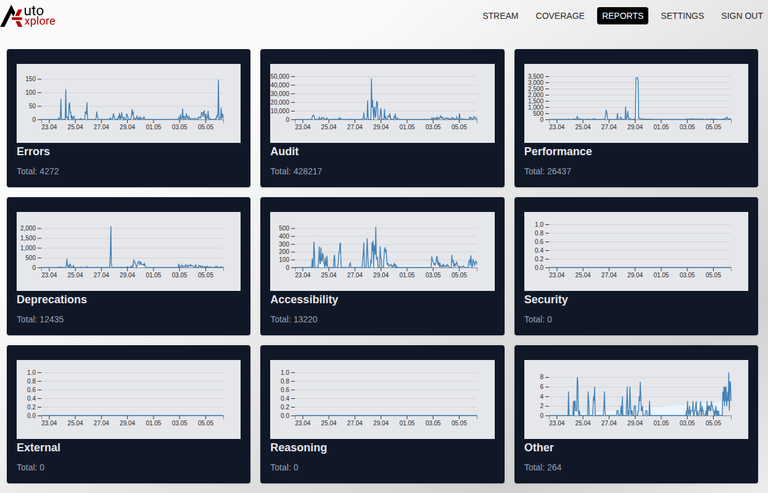
These categories are
- Errors Uncaught Javascript exceptions, failed http requests, error logs from browser console.
- Audit Browser audit results, form validation issues, client side validation etc.
- Performance Performance related audits, network traffic performance, page load times and slow Javascript code.
- Deprecations Deprecated API usage, deprecated HTML elements, deprecated CSS properties.
- Accessibility Accessibility issues, missing aria attributes, missing alt attributes, low text contrast etc.
- Security Security issues, missing security headers, insecure http requests, insecure cookies.
- External Issues detected outside the configured application domain.
- Reasoning LLM reasoning results from the service under test
- Other Issues that do not fit into any of the above categories, for example: Agent getting stuck on a specific view.
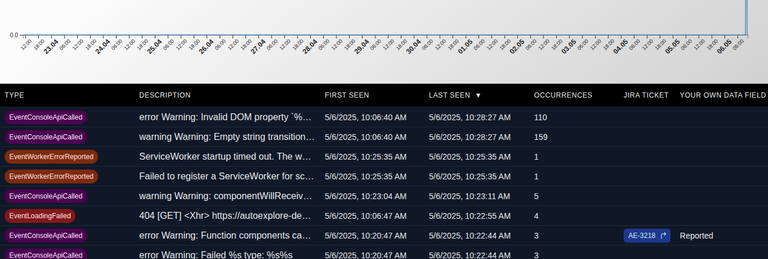
Each category can then be opened in a separate view that shows a list of issues that belong to that category. The list of issues is again grouped by the similarity of the issue. This allows counting how many times a similar issue has occurred and when it was first and last seen. Finally, selecting a group opens a detailed view of the issue.
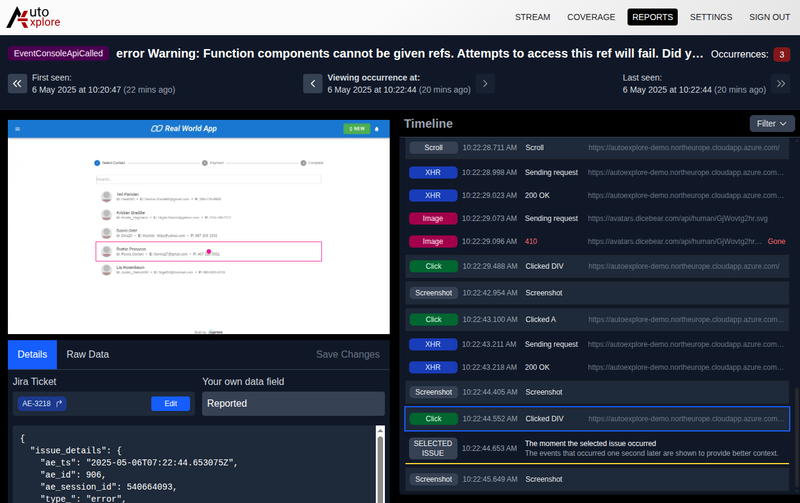
Detailed view
The detailed view shows the lowest level of details about the reported issue. It allows navigating through different variations of the same issue. It is useful to better understand the scope of the issue. If, for example, the same error has occurred on multiple pages, it can be related to a certain widget or a user flow.
Below the occurrence navigation menu, there is a timeline view that shows what the agent did during the selected occurrence and what happened on the application before and after the issue occurred. Timeline view allows navigating the agent steps using screenshots from the application, as well as understanding network race conditions by seeing when the network request started and when it finished. Certain issues only occur when network requests finish in an unexpected order.
Following the agent steps in the timeline view can help to understand the issue better and reproduce it, the steps can be easily followed even without technical knowledge.

Finally, the detailed view shows the information about the issue itself. This information varies depending on the type of issue.
At AutoExplore, we are committed to helping R&D teams implement autonomous testing as part of their development processes. Would you like to see what issues AutoExplore finds from your application? Contact us for a demo to learn more.